R Rainbows: Making a Pride Flag in R
By Benjamin Ackerman
June 1, 2019
🌈HAPPY PRIDE MONTH!!
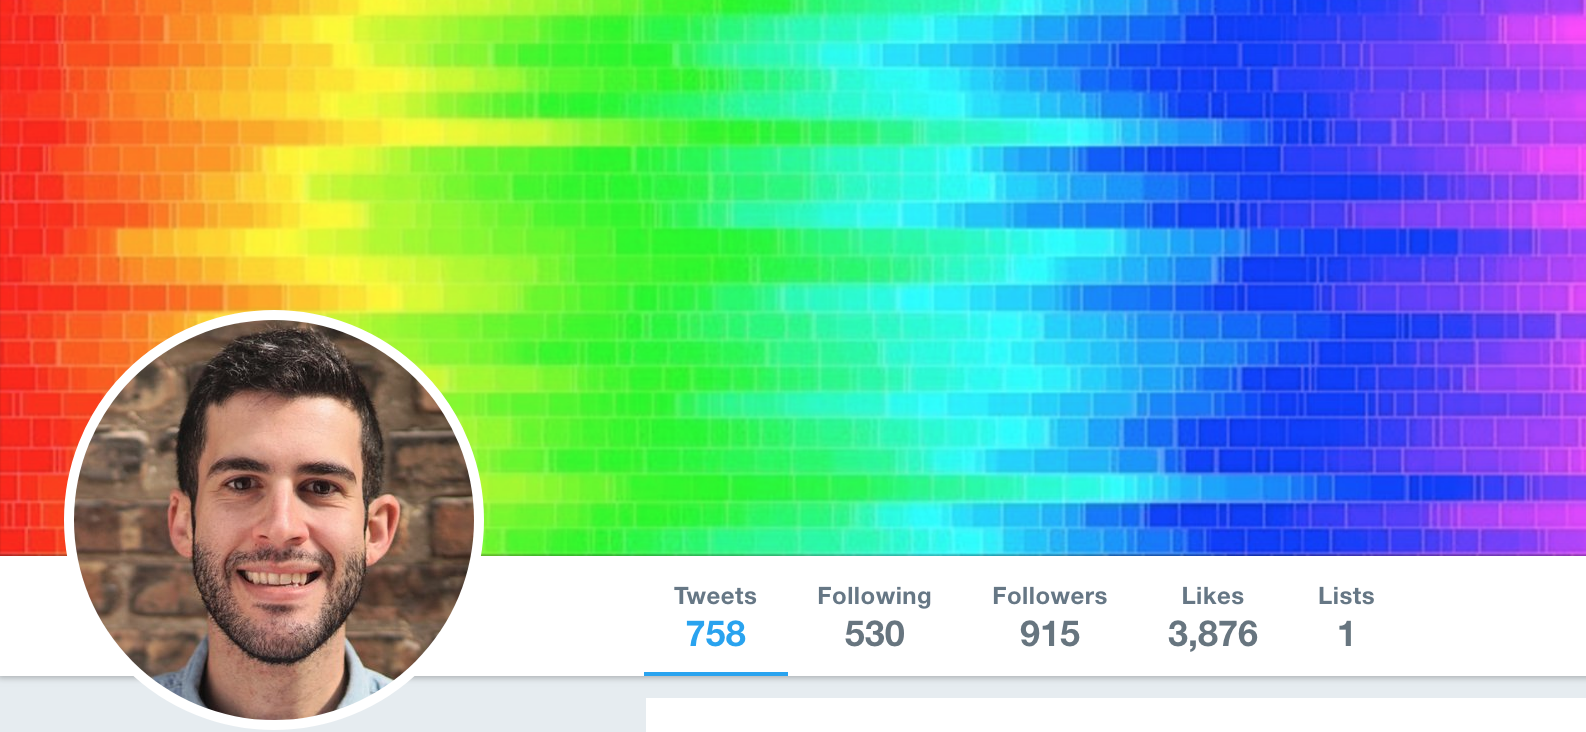
Fun fact: my rainbow Twitter banner (which I keep up year-round) was actually made using R! Given that pride season is officially upon us, I thought it’d be fun to share the code I wrote to generate a quick, fun ggplot rainbow flag.
To make the flag, I wrote a function, rainbow_flag(), which depends on one parameter, n. This will control how many colors of the rainbow I want to use (see examples below). I personally like how it looks when I set n = 100, but each one is different and beautiful!
I generate the data to have n categories, where each category has n random values ranging from 1:n (this is why I think you want at least n > 20).
Finally, I create my rainbow flag using geom_bar() to group and stack the data, and the rainbow() color palette function to specify how many colors on the rainbow gradient to use.
rainbow_flag = function(n){
  data = data.frame(x = rep(1:n,n),
                  y = sample(1:n,n*n,replace=T))

  p = ggplot(data) +
    geom_bar(aes(x, group = y,fill=y), width = 1) +
    scale_fill_gradientn(colours = rainbow(n)) +
    theme_void() +
    theme(legend.position = "none")

  return(p)
}
Here’s what it looks like when n = 25: 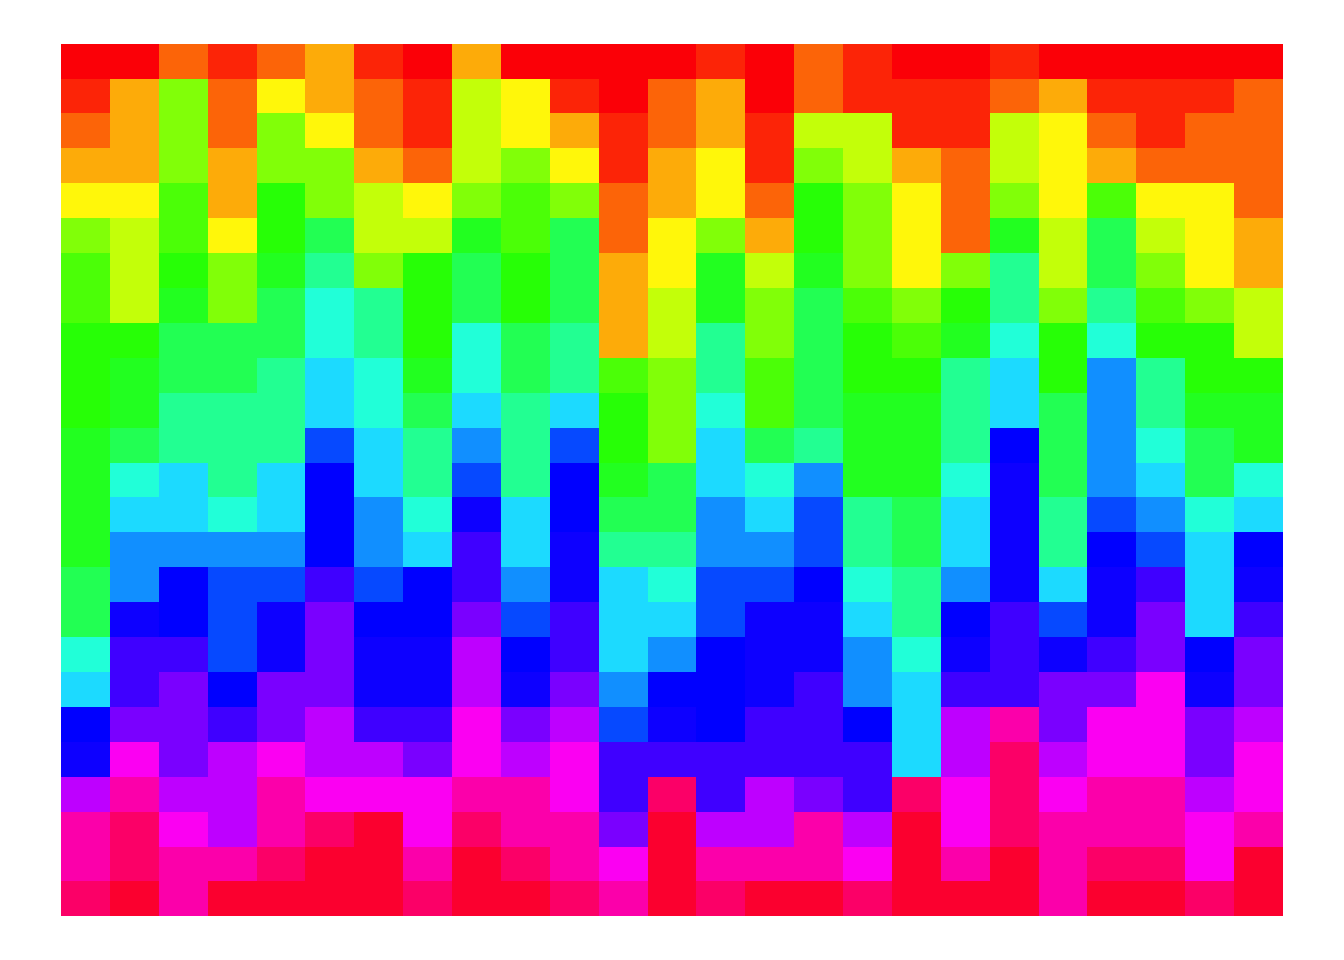
when n = 50: 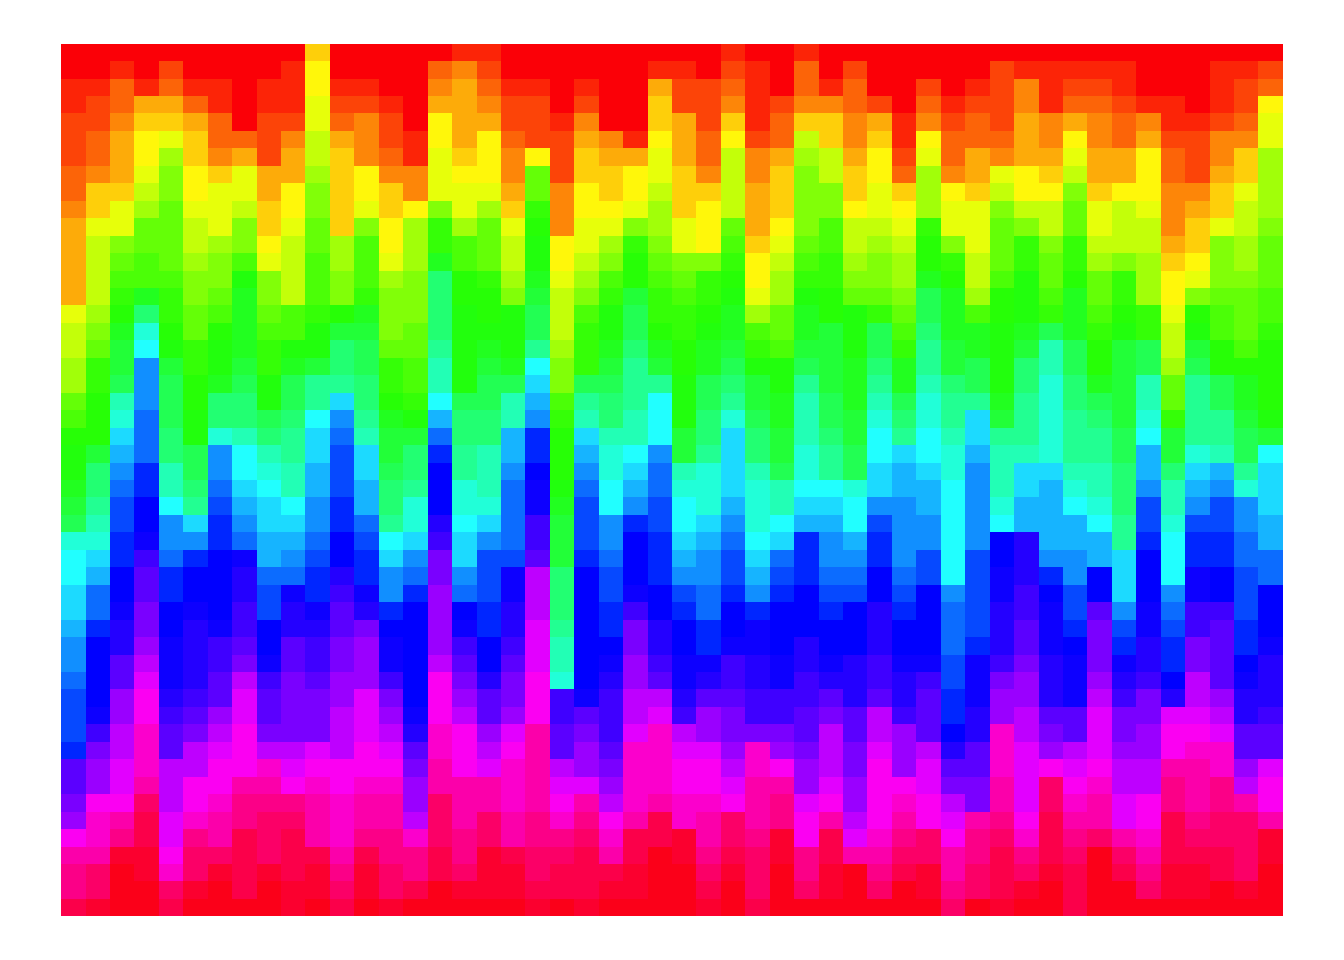
and when n = 100: 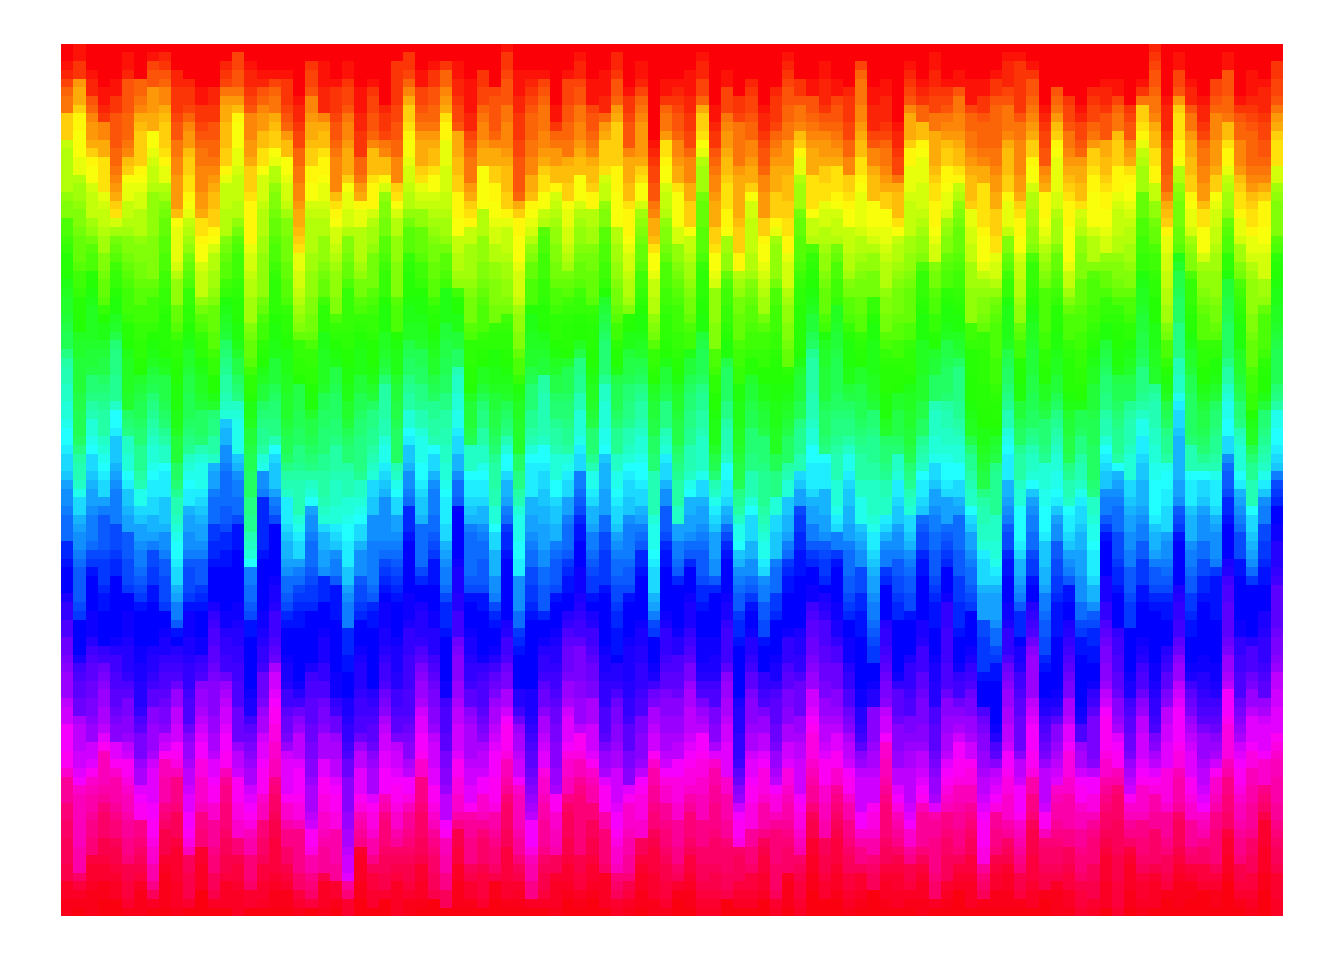
While I know it would be a lot easier to plot six colors in perfect horizontal stripes, I personally like this type of mosaic plot that keeps the rainbow color gradient but adds some randomness to it. Without setting the seed, I like that this code creates a different plot every time, celebrating both pride and individuality! 🎉
Feel free to take the code and modify it as you please, and share the rainbow flag you create! I rotated and cropped one to make it my Twitter banner. It would be awesome to see Twitter flooded with R Rainbows for the month of June and beyond!