Tidying and Visualizing TV Ratings Data in R
By Benjamin Ackerman
February 9, 2018
About three years ago, I received a letter in the mail from Nielsen inviting me to participate in one of their panels. After spending a while on the phone with a representative to determine that it wasn’t a scam, I figured I’d give it a go. I tend to take great interest in knowing where data come from (especially when reporters and media sources try to use statistics to make a point), and as an avid tv watcher, it was cool to learn more about how Nielsen generates ratings and estimates program viewership. My randomly sampled “household” would represent thousands of similarly characterized “households” - white male, early 20s, unmarried, lives alone, etc. - and as long as I kept a small meter in my pocket, my televison-watching habits would contribute to “the ratings” (in retrospect, I’m sure I watched way more RuPaul’s Drag Race and Project Runway than the average early 20s male… 👀).
After completing the panel, I’ve been more curious about how companies use Nielsen data to inform decision making (i.e. renewing/canceling shows, optimizing time slots), and about how the data are shared publicly (snippets of ratings information get shared on Wikipedia, on blogs, etc). Since I’ve been wanting to start blogging more, I thought it would be fun to write my first post about how to wrangle and analyze TV ratings data in R!
Finding and tidying data
I happened to come across this blog, which has a wealth of data on tv/movie ratings, such as weekly reports on the viewership of every program on a major broadcast network network (here’s an example of one such report, which I’ll try to download and tidy).
In order to read in the PDF text in R, I decided to use pdftools. There are a few other packages out there that do a similar job, like tabularize, but I found pdftools to be the simplest and easiest to use. Given the formatting of the table (variable names and values containing spaces, nothing cleanly or consistently delimited), there was no clean and simple way to turn the text into a data frame, so I had to use some clever regular expressions to turn this:
## [1] "/Users/BenAckerman/Documents/apreshill/content/post/2018-02-09-TVratings"## [1] " Complete Nielsen Ratings: January 22 - 28, 2018\nP2+ R A18-34 R A18-49 R A25-54 R Day Time Net Program P2+ * A18-34 A18-49 A25-54 P2 +/-\n 17 4 5 10 Mon 8:00 ABC The Bachelor 6.38 1.6 1.8 2.1\n 4 6 6 6 Mon 10:00 ABC The Good Doctor 9.61 1.2 1.7 2.2 51%\n 9 17 14 11 Mon 8:00 CBS Kevin Can Wait 7.37 0.7 1.3 2.0\n 14 23 18 12 Mon 8:30 CBS Man with a Plan 6.74 0.6 1.2 1.9 -9%\n 23 41 31 22 Mon 9:00 CBS Superior Donuts 5.68 0.5 1.0 1.6 -16%\n 33 52 46 37 Mon 9:30 CBS 9JKL 4.72 0.4 0.8 1.3 -17%\n 27 51 45 34 Mon 10:00 CBS Scorpion 5.23 0.4 0.8 1.3 11%\n 76 61 78 71 Mon 8:00 CW Supergirl 2.07 0.4 0.5 0.8\n 92 95 93 94 Mon 9:30 CW Valor 0.97 0.1 0.2 0.2 -53%\n 52 35 43 40 Mon 8:00 FOX Lucifer 3.77 0.6 0.9 1.3\n 34 29 32 29 Mon 9:00 FOX The Resident 4.70 0.6 1.0 1.4 25%\n 22 21 20 21 Mon 8:00 NBC The Wall 5.78 0.7 1.2 1.6\n 30 27 38 35 Mon 9:"into something nice and tidy like this!
latest_date = "2018-01-29"
get_ratings(latest_date)| program | network | weekday | time | date | viewers_millions | P2_ranking | A18_34_ranking | A18_49_ranking | A25_54_ranking | A18_34 | A18_49 | A25_54 | P2_change | start_of_week | rerun |
|---|---|---|---|---|---|---|---|---|---|---|---|---|---|---|---|
| The Bachelor | ABC | Mon | 8:00 | 2018-01-29 | 6.36 | 19 | 5 | 8 | 11 | 1.5 | 1.7 | 2.0 | NA | 2018-01-29 | FALSE |
| The Good Doctor | ABC | Mon | 10:00 | 2018-01-29 | 5.00 | 32 | 45 | 49 | 47 | 0.5 | 0.8 | 1.1 | -21% | 2018-01-29 | TRUE |
| Kevin Can Wait | CBS | Mon | 8:00 | 2018-01-29 | 7.28 | 12 | 22 | 15 | 10 | 0.6 | 1.2 | 2.0 | NA | 2018-01-29 | FALSE |
| Man with a Plan | CBS | Mon | 8:30 | 2018-01-29 | 6.64 | 17 | 37 | 21 | 13 | 0.5 | 1.1 | 1.8 | -9% | 2018-01-29 | FALSE |
| Superior Donuts | CBS | Mon | 9:00 | 2018-01-29 | 5.80 | 25 | 42 | 30 | 18 | 0.5 | 1.0 | 1.7 | -13% | 2018-01-29 | FALSE |
| 9JKL | CBS | Mon | 9:30 | 2018-01-29 | 4.82 | 34 | 52 | 40 | 32 | 0.4 | 0.9 | 1.4 | -17% | 2018-01-29 | FALSE |
| Scorpion | CBS | Mon | 10:00 | 2018-01-29 | 5.82 | 24 | 51 | 38 | 29 | 0.4 | 0.9 | 1.4 | 21% | 2018-01-29 | FALSE |
| Supergirl | CW | Mon | 8:00 | 2018-01-29 | 2.11 | 73 | 61 | 66 | 66 | 0.4 | 0.6 | 0.8 | NA | 2018-01-29 | FALSE |
| Valor | CW | Mon | 9:00 | 2018-01-29 | 1.07 | 84 | 85 | 88 | 86 | 0.2 | 0.2 | 0.3 | -49% | 2018-01-29 | FALSE |
| Lucifer | FOX | Mon | 8:00 | 2018-01-29 | 3.67 | 46 | 31 | 50 | 42 | 0.6 | 0.8 | 1.2 | NA | 2018-01-29 | FALSE |
| The Resident | FOX | Mon | 9:00 | 2018-01-29 | 4.75 | 36 | 28 | 42 | 35 | 0.6 | 0.9 | 1.3 | 29% | 2018-01-29 | FALSE |
| The Wall | NBC | Mon | 8:00 | 2018-01-29 | 5.42 | 29 | 26 | 22 | 59 | 0.6 | 1.1 | 0.9 | NA | 2018-01-29 | FALSE |
| Better Late Than Never | NBC | Mon | 9:00 | 2018-01-29 | 4.78 | 35 | 46 | 41 | 34 | 0.5 | 0.9 | 1.3 | -12% | 2018-01-29 | FALSE |
| The Brave | NBC | Mon | 10:00 | 2018-01-29 | 3.90 | 41 | 54 | 56 | 55 | 0.4 | 0.7 | 1.0 | -18% | 2018-01-29 | FALSE |
| Fresh off The Boat | ABC | Tue | 8:00 | 2018-01-30 | 4.05 | 39 | 30 | 33 | 36 | 0.6 | 1.0 | 1.3 | NA | 2018-01-29 | FALSE |
| Fresh off The Boat | ABC | Tue | 8:30 | 2018-01-30 | 3.46 | 51 | 33 | 45 | 44 | 0.6 | 0.9 | 1.2 | -15% | 2018-01-29 | FALSE |
| State Of The Union N/A | ABC | Tue | 9:00 | 2018-01-30 | NA | 94 | 94 | 94 | 94 | NA | NA | NA | NA | 2018-01-29 | FALSE |
| SOTU Analysis | ABC | Tue | 10:30 | 2018-01-30 | 3.61 | 49 | 65 | 61 | 60 | 0.3 | 0.6 | 0.9 | NA | 2018-01-29 | FALSE |
| Super Bowl Greatest Commercials | CBS | Tue | 8:00 | 2018-01-30 | 7.31 | 11 | 39 | 20 | 17 | 0.5 | 1.1 | 1.7 | NA | 2018-01-29 | FALSE |
| State Of The Union N/A | CBS | Tue | 9:00 | 2018-01-30 | NA | 95 | 95 | 95 | 95 | NA | NA | NA | NA | 2018-01-29 | FALSE |
| SOTU Analysis | CBS | Tue | 10:30 | 2018-01-30 | 4.91 | 33 | 27 | 39 | 41 | 0.6 | 0.9 | 1.2 | NA | 2018-01-29 | FALSE |
| The Flash | CW | Tue | 8:00 | 2018-01-30 | 2.60 | 69 | 20 | 48 | 53 | 0.7 | 0.9 | 1.1 | NA | 2018-01-29 | FALSE |
| Black Lightning | CW | Tue | 9:00 | 2018-01-30 | 2.12 | 72 | 36 | 54 | 64 | 0.6 | 0.8 | 0.9 | -18% | 2018-01-29 | FALSE |
| Lethal Weapon | FOX | Tue | 8:00 | 2018-01-30 | 2.87 | 64 | 58 | 63 | 62 | 0.4 | 0.6 | 0.9 | NA | 2018-01-29 | FALSE |
| State Of The Union N/A | FOX | Tue | 9:00 | 2018-01-30 | NA | 96 | 96 | 96 | 96 | NA | NA | NA | NA | 2018-01-29 | FALSE |
| Ellen’s Game of Games | NBC | Tue | 8:00 | 2018-01-30 | 7.58 | 10 | 9 | 7 | 8 | 1.1 | 1.8 | 2.4 | NA | 2018-01-29 | FALSE |
| State Of The Union N/A | NBC | Tue | 9:00 | 2018-01-30 | NA | 97 | 97 | 97 | 97 | NA | NA | NA | NA | 2018-01-29 | FALSE |
| SOTU Analysis | NBC | Tue | 10:30 | 2018-01-30 | 5.92 | 23 | 17 | 13 | 15 | 0.7 | 1.3 | 1.8 | NA | 2018-01-29 | FALSE |
| The Goldbergs | ABC | Wed | 8:00 | 2018-01-31 | 4.33 | 37 | 47 | 23 | 27 | 0.5 | 1.1 | 1.5 | NA | 2018-01-29 | TRUE |
| Speechless | ABC | Wed | 8:30 | 2018-01-31 | 3.20 | 57 | 50 | 47 | 50 | 0.5 | 0.9 | 1.1 | -26% | 2018-01-29 | TRUE |
| Modern Family | ABC | Wed | 9:00 | 2018-01-31 | 3.49 | 50 | 48 | 44 | 43 | 0.5 | 0.9 | 1.2 | 9% | 2018-01-29 | TRUE |
| American Housewife | ABC | Wed | 9:30 | 2018-01-31 | 2.97 | 63 | 57 | 53 | 52 | 0.4 | 0.8 | 1.1 | -15% | 2018-01-29 | TRUE |
| Match Game | ABC | Wed | 10:00 | 2018-01-31 | 2.85 | 66 | 60 | 59 | 58 | 0.4 | 0.7 | 1.0 | -4% | 2018-01-29 | FALSE |
| The Amazing Race | CBS | Wed | 8:00 | 2018-01-31 | 6.57 | 18 | 12 | 12 | 14 | 0.8 | 1.3 | 1.8 | NA | 2018-01-29 | FALSE |
| SEAL Team | CBS | Wed | 9:00 | 2018-01-31 | 6.65 | 16 | 41 | 27 | 24 | 0.5 | 1.0 | 1.5 | 1% | 2018-01-29 | FALSE |
| Criminal Minds | CBS | Wed | 10:00 | 2018-01-31 | 5.42 | 30 | 44 | 32 | 31 | 0.5 | 1.0 | 1.4 | -18% | 2018-01-29 | FALSE |
| Riverdale | CW | Wed | 8:00 | 2018-01-31 | 1.34 | 81 | 63 | 70 | 76 | 0.4 | 0.5 | 0.5 | NA | 2018-01-29 | FALSE |
| Dynasty | CW | Wed | 9:00 | 2018-01-31 | 0.65 | 88 | 86 | 89 | 92 | 0.2 | 0.2 | 0.2 | -51% | 2018-01-29 | FALSE |
| The X-Files | FOX | Wed | 8:00 | 2018-01-31 | 3.64 | 47 | 32 | 43 | 38 | 0.6 | 0.9 | 1.3 | NA | 2018-01-29 | FALSE |
| 9-1-1 | FOX | Wed | 9:00 | 2018-01-31 | 6.21 | 21 | 8 | 9 | 9 | 1.2 | 1.6 | 2.1 | 71% | 2018-01-29 | FALSE |
| The Blacklist | NBC | Wed | 8:00 | 2018-01-31 | 6.11 | 22 | 25 | 29 | 26 | 0.6 | 1.0 | 1.5 | NA | 2018-01-29 | FALSE |
| Law & Order: SVU | NBC | Wed | 9:00 | 2018-01-31 | 5.48 | 28 | 18 | 18 | 21 | 0.7 | 1.2 | 1.6 | -10% | 2018-01-29 | FALSE |
| Chicago PD | NBC | Wed | 10:00 | 2018-01-31 | 6.72 | 15 | 16 | 17 | 20 | 0.7 | 1.2 | 1.6 | 23% | 2018-01-29 | FALSE |
| Grey’s Anatomy | ABC | Thu | 8:00 | 2018-02-01 | 8.93 | 8 | 4 | 6 | 6 | 1.7 | 2.3 | 2.7 | NA | 2018-01-29 | FALSE |
| Scandal | ABC | Thu | 9:00 | 2018-02-01 | 5.62 | 27 | 10 | 11 | 16 | 1.0 | 1.4 | 1.8 | -37% | 2018-01-29 | FALSE |
| HTGAWM | ABC | Thu | 10:00 | 2018-02-01 | 3.68 | 45 | 19 | 34 | 37 | 0.7 | 1.0 | 1.3 | -35% | 2018-01-29 | FALSE |
| The Big Bang Theory | CBS | Thu | 8:00 | 2018-02-01 | 14.69 | 4 | 6 | 4 | 4 | 1.4 | 2.9 | 4.3 | NA | 2018-01-29 | FALSE |
| Young Sheldon | CBS | Thu | 8:30 | 2018-02-01 | 12.92 | 5 | 7 | 5 | 5 | 1.2 | 2.3 | 3.5 | -12% | 2018-01-29 | FALSE |
| Mom | CBS | Thu | 9:00 | 2018-02-01 | 9.11 | 7 | 15 | 10 | 7 | 0.7 | 1.5 | 2.4 | -29% | 2018-01-29 | FALSE |
| Life in Pieces | CBS | Thu | 9:30 | 2018-02-01 | 7.11 | 14 | 23 | 16 | 12 | 0.6 | 1.2 | 1.8 | -22% | 2018-01-29 | FALSE |
While the full code for the function get_ratings can be found in this Github repo, I’ll explain a little about the regular expressions I used. Let’s use this one line of the PDF text as an example:
## [1] " 6 6 6 Mon 10:00 ABC The Good Doctor 9.61 1.2 1.7 2.2 51%\n 9 "First, I identified some groups of elements to extract together. Since I have a fairly limited knowledge of regex semantics, the process of extracting elements from these lines was made significantly easier by using the rebus package in R. Here’s a flow of how the rebus expressions I wrote translated as regular expressions, followed by the elements extracted:
Group 1:
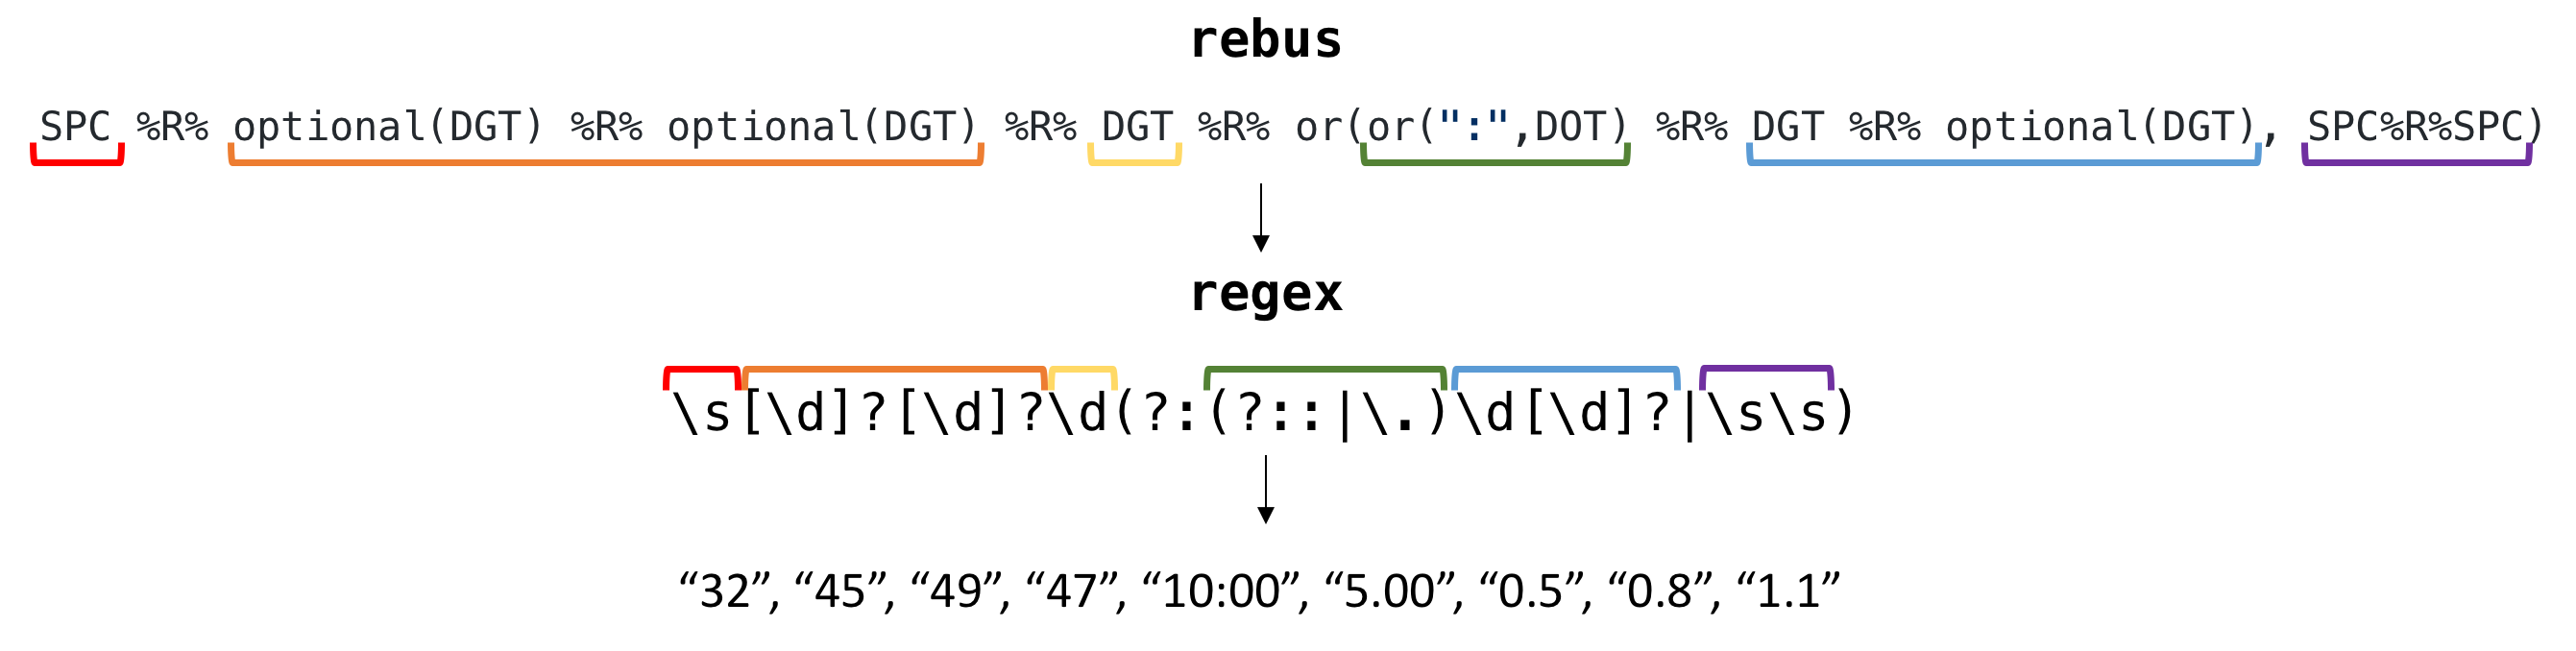
Group 2:
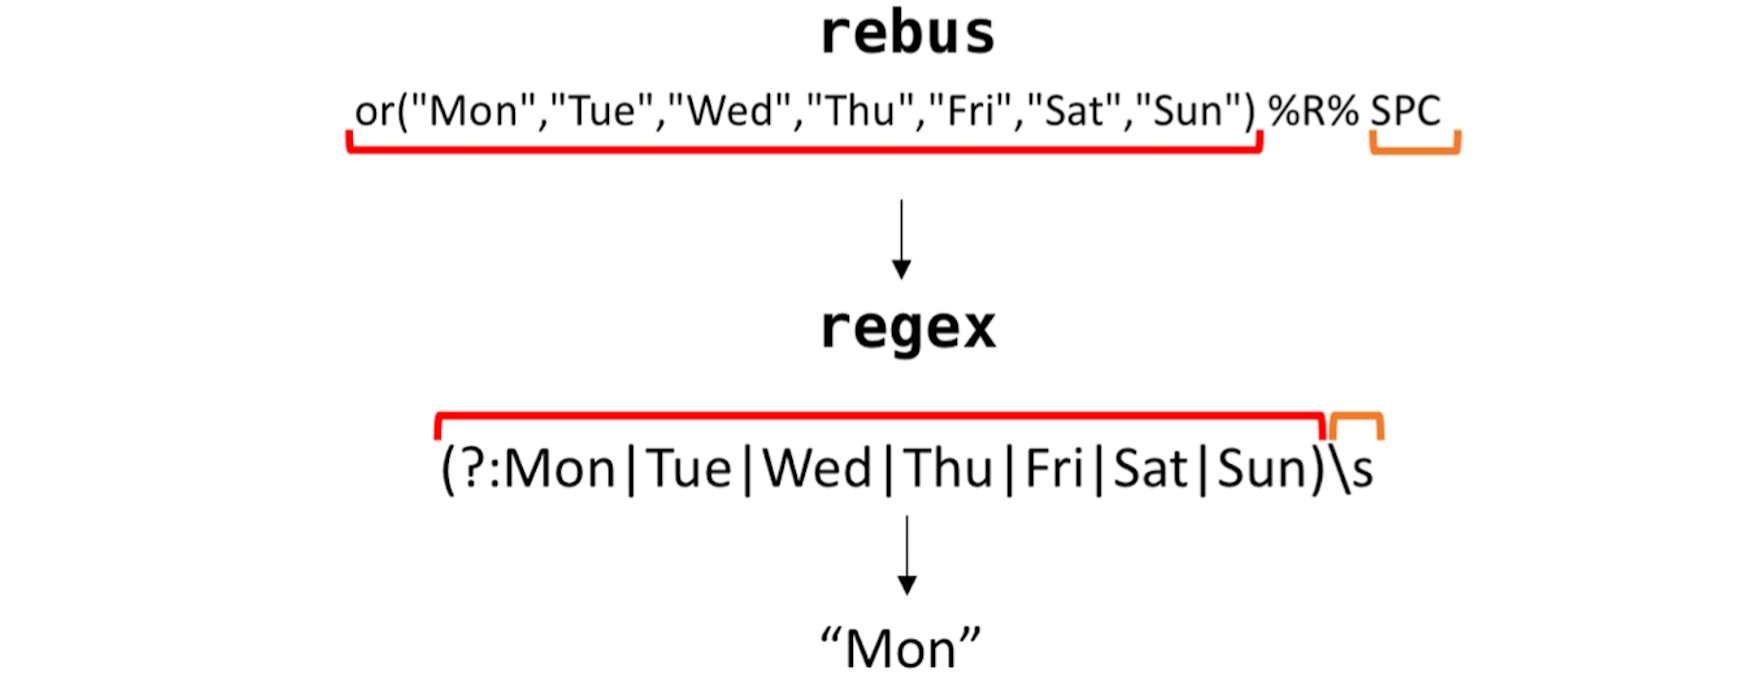
Group 3: 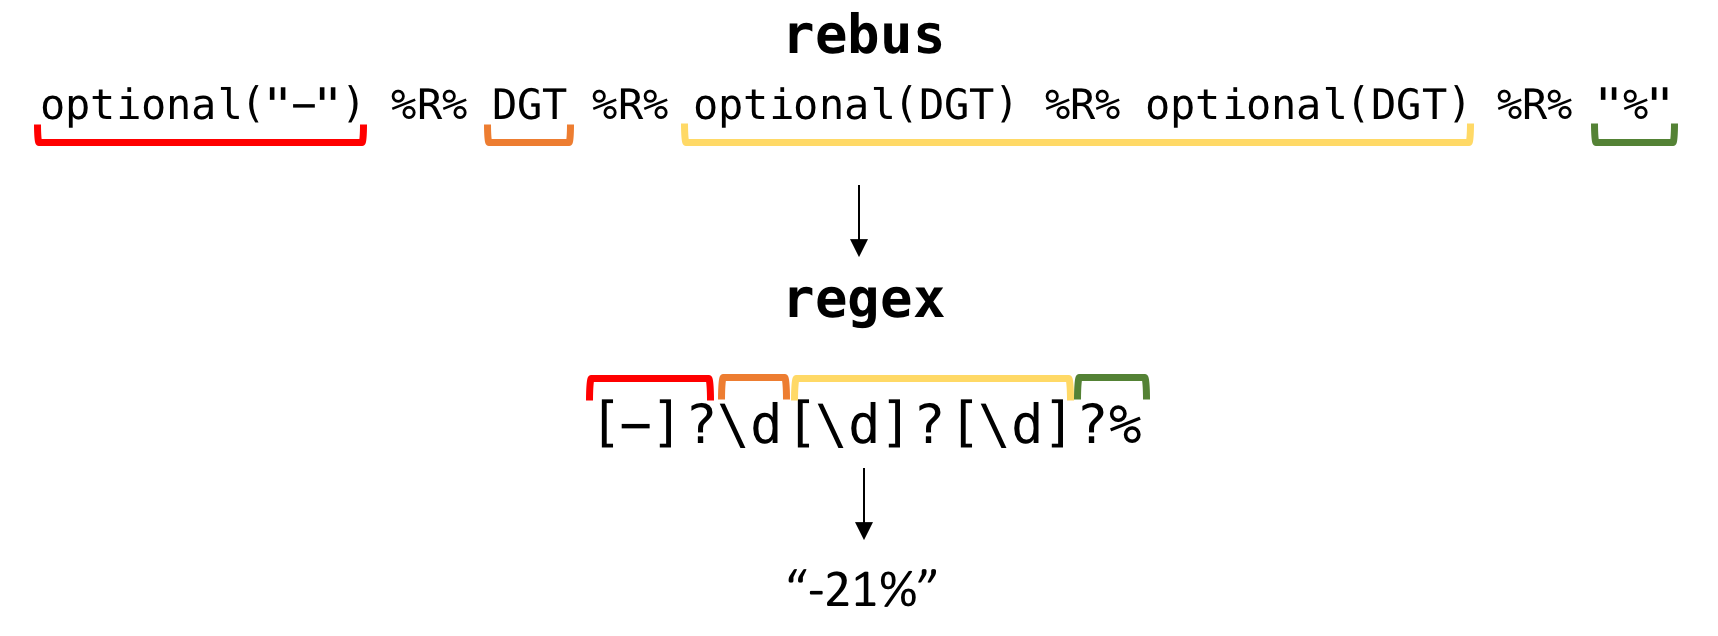
Bless you, rebus 🙏🏻. Next, I removed all of the elements above from the string to leave the network and program name, which I then split up into separate elements. All in all, it took a lot of trial and error to figure out the best regular expressions patterns to use, and while this may not be the prettiest or most efficient way to extract the data, it got the job done!
Visualizing the data
Once the data were tidy, the fun could begin! First, I wanted to see what the 20 most viewed programs were last week. I decided to exclude any reruns of shows to keep the list about new TV content.
data %>%
  filter(rerun == FALSE) %>%
  top_n(n=20,wt = viewers_millions) %>%
  select(network,program,viewers_millions,P2_ranking) %>%
  ggplot()+geom_bar(aes(x = reorder(program,viewers_millions),y = viewers_millions,fill=network),stat = 'identity')+coord_flip()+
  labs(x = "TV Show", y = "Viewers (millions)", title="Most Watched Programs on Broadcast TV from January 29-February 4, 2018") + theme_minimal() + scale_y_continuous(expand=c(0,0))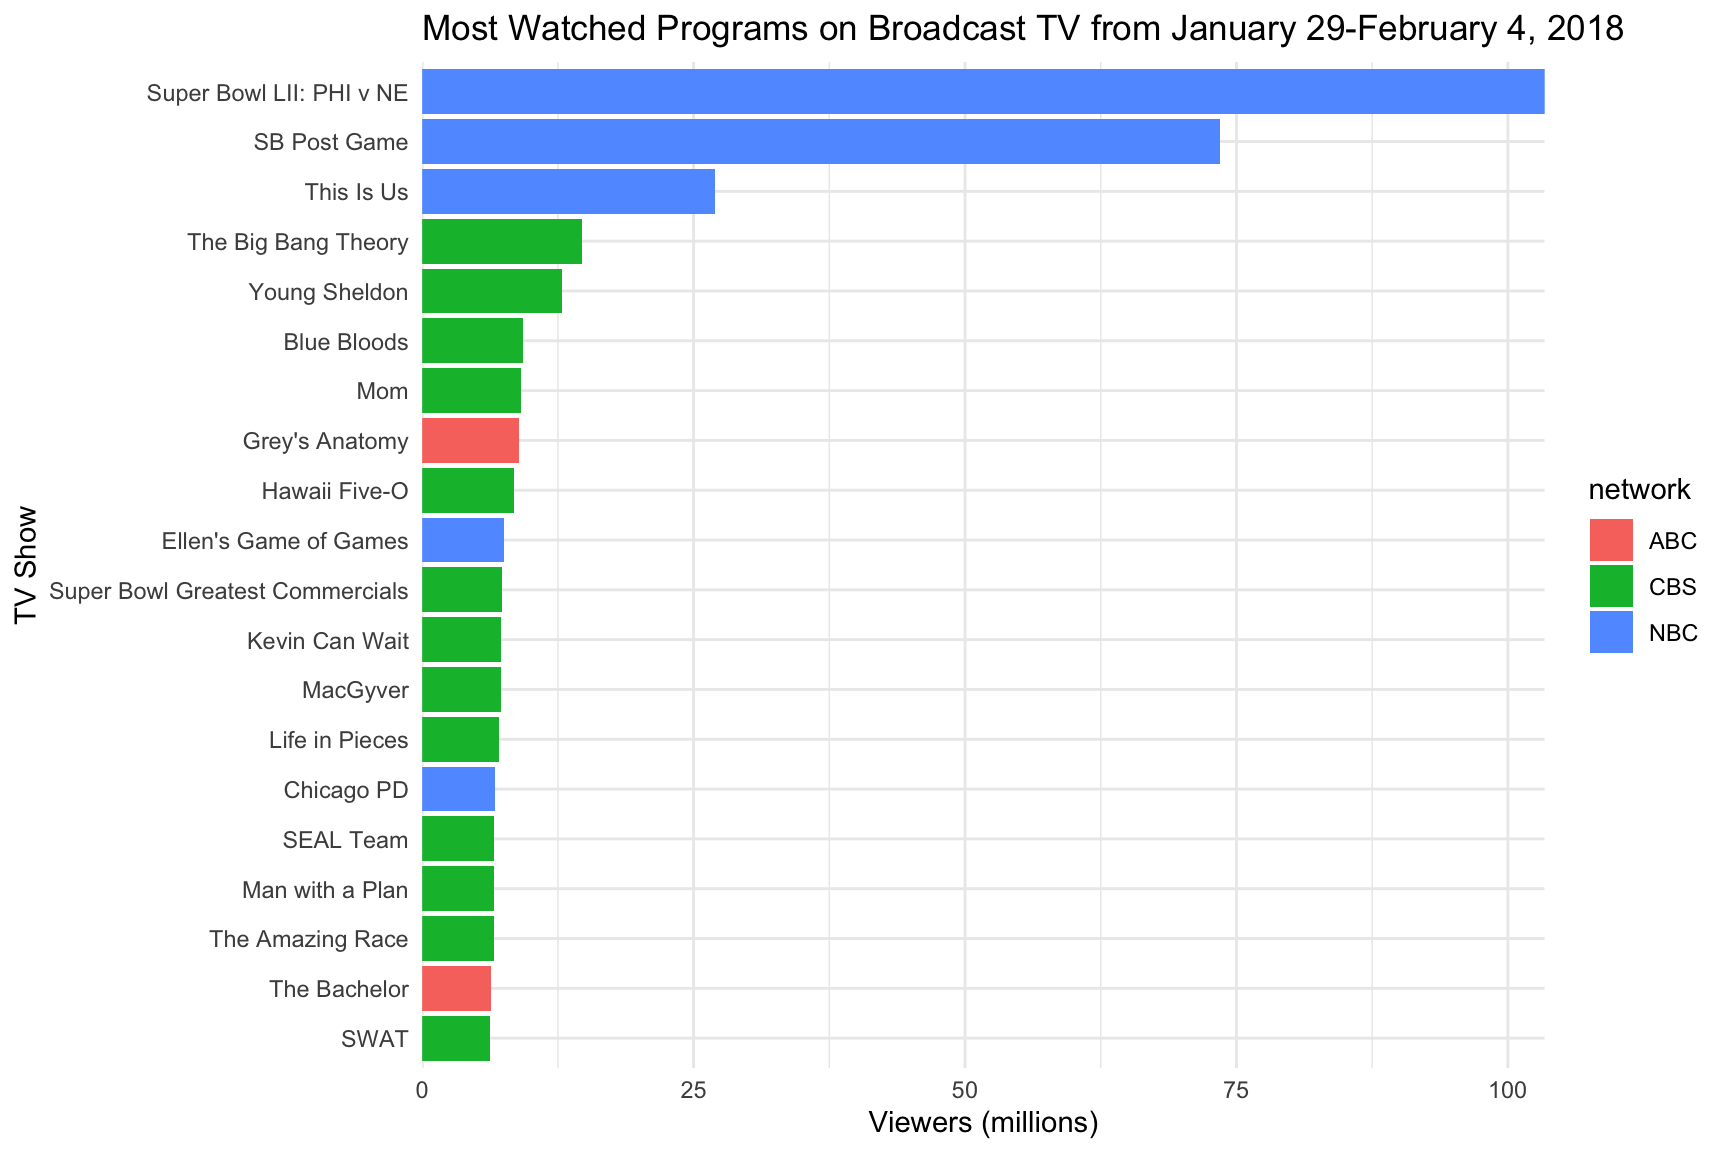
Unsurprisingly, the Super Bowl and its Post Game commentary dominated the weekly ratings, and This Is Us probably benifited a great deal from the post-Super Bowl time slot. CBS seems to have a lot of popular shows, while Fox and the CW didn’t even make the list. Unfortunately, data from each network’s airing of the State of the Union were not included in the PDF, so they did not make the cut either (though contrary to what one man thinks, this was not the most watched SOTU ever).
Next, I was curious to see which network received the highest average number of views on a daily basis. I decided to just look at Monday-Saturday, since we all know what everyone was watching this past Sunday…
data %>%
  group_by(network,weekday) %>%
  filter(!weekday == "Sun") %>%
  summarise(avgviews = mean(viewers_millions,na.rm=TRUE)) %>%
  ggplot()+geom_line(aes(x = weekday,y = avgviews,group=network,col=network))+
  scale_x_discrete(limits = c("Mon","Tue","Wed","Thu","Fri","Sat"))+ labs(y = "Average Number of Viewers (millions)")+theme_minimal() + scale_y_continuous(expand=c(0,0))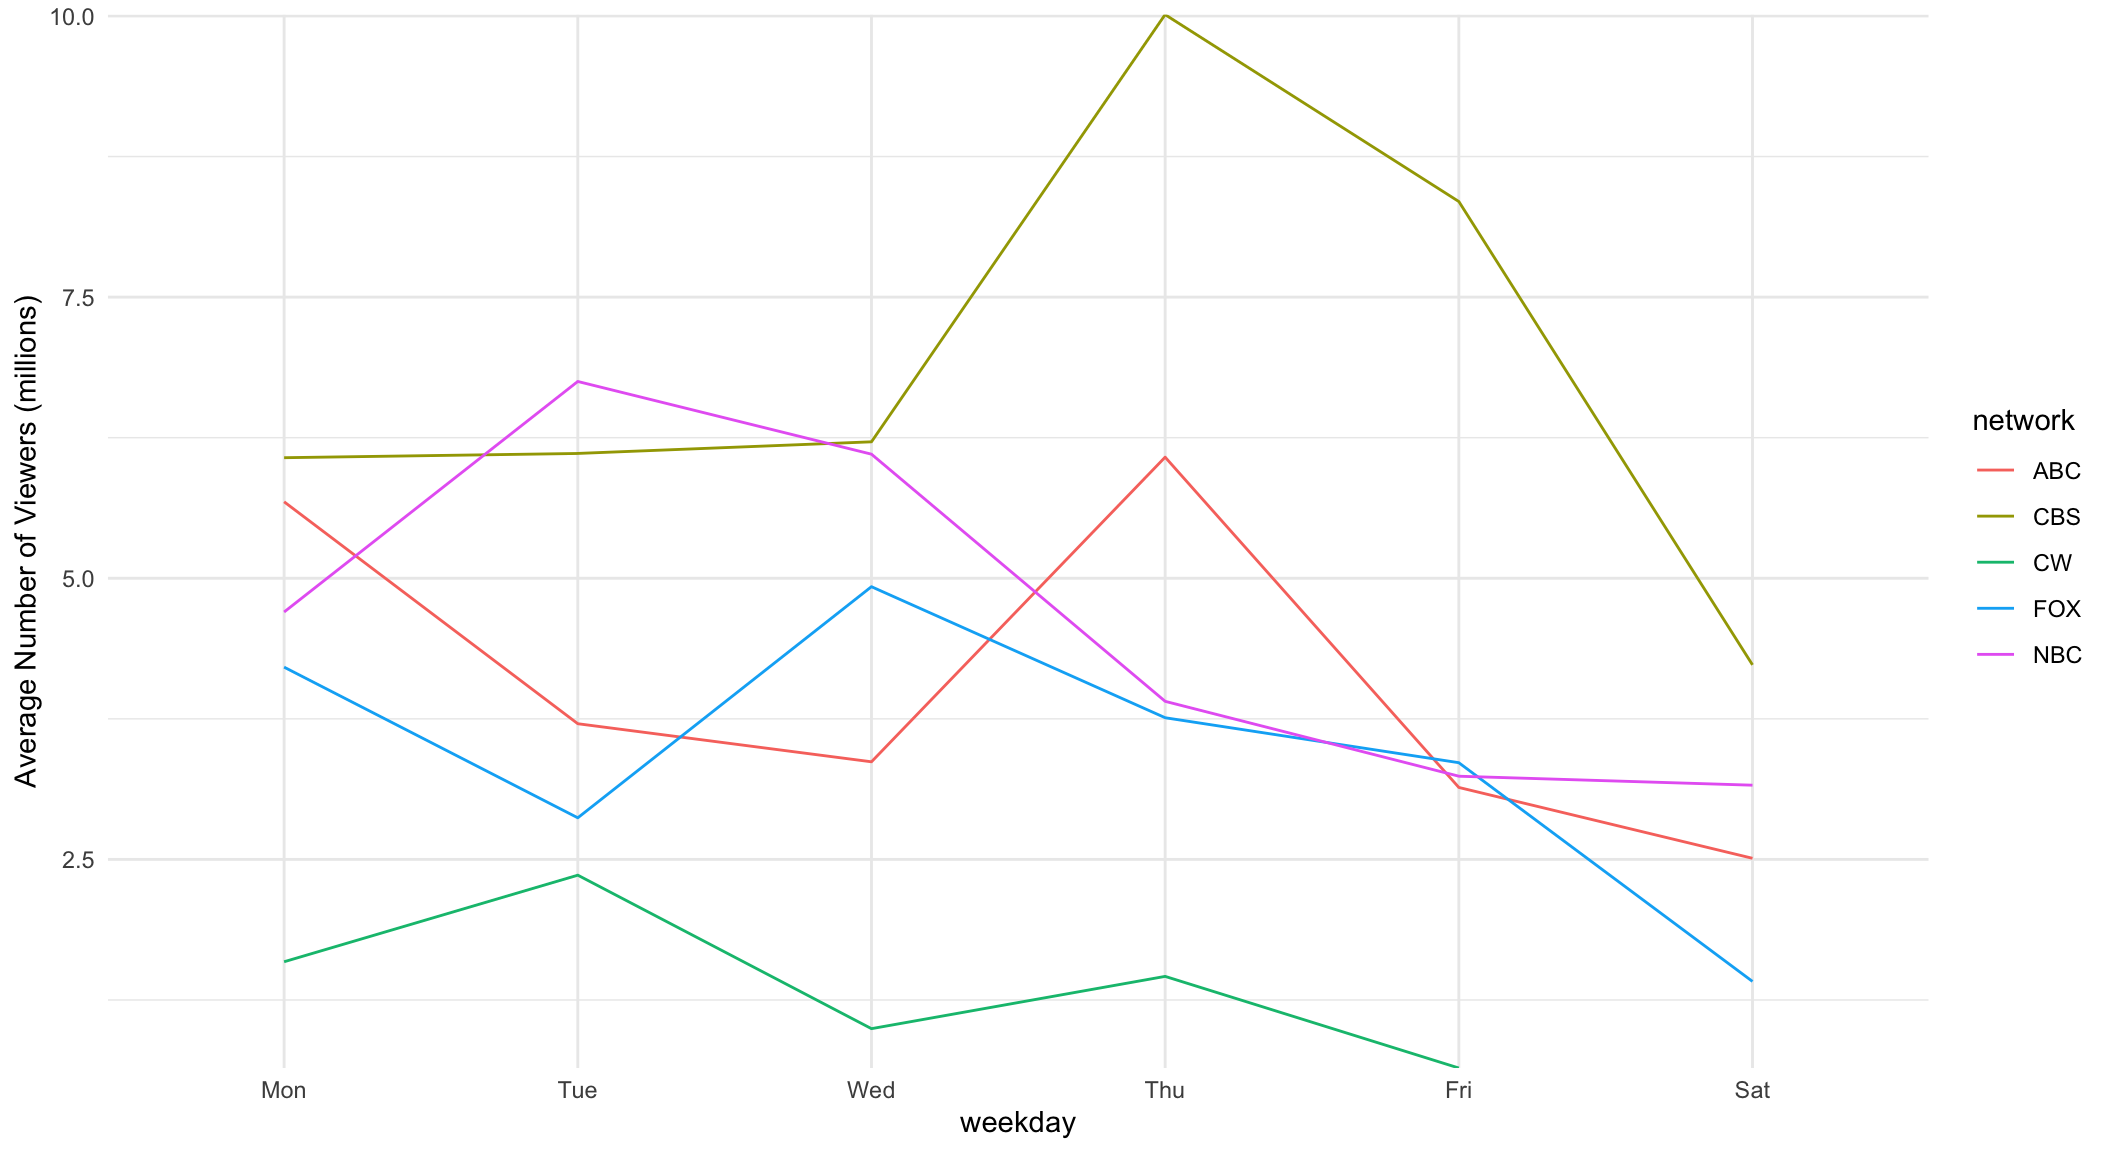
It looks like the CW consistently underperforms in ratings compared to the other major broadcast networks. Also, Thursday night is clearly the best night for ABC (Shondaland, anybody?? 🍷🍿).
Lastly, I was wondering how viewership and ratings changed over the past month. By defining a vector of dates over the past month when the PDFs were posted, and then using the map_df function in the purrr package, I was able to pretty easily gather all of the past month’s data in a single data frame. Again, I restricted the rankings to only show new content, and I compiled lists of the 10 most viewed programs by week (I used spread from tidyr to distribute the resulting names across four columns, which formed a neat table to display!)
dates = as.Date(latest_date)-7*c(0:3)

dates %>%
  map_df(~get_ratings(.)) %>%
  filter(rerun == FALSE) %>%
  group_by(start_of_week) %>%
  top_n(n=10,wt = viewers_millions) %>%
  arrange(desc(start_of_week),desc(viewers_millions)) %>%
  select(program,start_of_week) %>%
  ungroup() %>%
  bind_cols(ranking = rep(1:10,4)) %>%
  spread(start_of_week,program) %>%
  kable("html") %>%
kable_styling()| ranking | 2018-01-08 | 2018-01-15 | 2018-01-22 | 2018-01-29 |
|---|---|---|---|---|
| 1 | NFL Playoff Overrun | NFC Championship Game: PHI v MIN | 60th Grammy Awards | Super Bowl LII: PHI v NE |
| 2 | NFL Div. Playoff: TEN v NE | NFC Post-Game | NCIS | SB Post Game |
| 3 | The OT | NFC Trophy | BULL | This Is Us |
| 4 | The Big Bang Theory | The Big Bang Theory | The Good Doctor | The Big Bang Theory |
| 5 | NCIS | Young Sheldon | This Is Us | Young Sheldon |
| 6 | Young Sheldon | This Is Us | NCIS: New Orleans | Blue Bloods |
| 7 | BULL | Blue Bloods | Grey’s Anatomy | Mom |
| 8 | Blue Bloods | The Good Doctor | Ellen’s Game of Games | Grey’s Anatomy |
| 9 | This Is Us | MOM | Kevin Can Wait | Hawaii Five-O |
| 10 | MOM | Hawaii Five-O | Grammy Red Carpet | Ellen’s Game of Games |
Again, no shock that Americans looooooove their football… 🏈
So there you have it! I had a lot of exploring these data, and there are tons of other visualizations and analyses that these data can be used for. Again, the code with the function to obtain the data can be found on Github - I would love to see what else you can come up with while using it! 😬🎉